pV diagram of Carnot cycle. The area bounded by the complete cycle path represents the total work done during one cycle.
The Carnot cycle is often plotted on a pressure-volume diagram (pV diagram) and a temperature-entropy diagram (Ts diagram).
When plotted on a pressure-volume diagram, the isothermal processes follow the gas’s isotherm lines, adiabatic processes move between isotherms, and the area bounded by the complete cycle path represents the total work that can be done during one cycle.
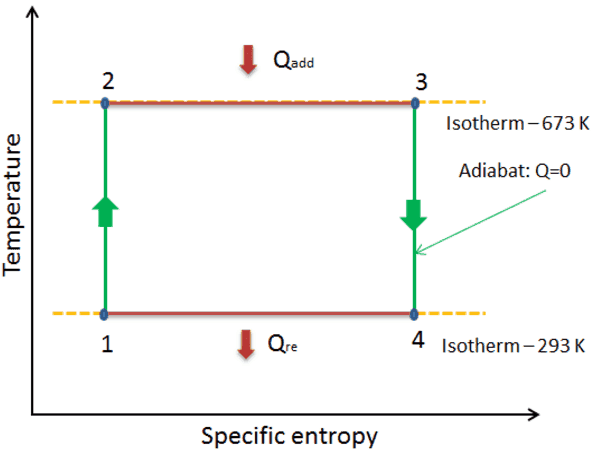
The temperature-entropy diagram (Ts diagram), in which the thermodynamic state is specified by a point on a graph with specific entropy (s) as the horizontal axis and absolute temperature (T) as the vertical axis, is the best diagram to describe the behavior of a Carnot cycle.
It is a useful and common tool, particularly because it helps visualize the heat transfer during a process. For reversible (ideal) processes, the area under the T-s curve of a process is the heat transferred to the system during that process.
Ts diagram of Carnot cycle. The area under the Ts curve of a process is the heat transferred to the system during that process.
References:
Nuclear and Reactor Physics:
J. R. Lamarsh, Introduction to Nuclear Reactor Theory, 2nd ed., Addison-Wesley, Reading, MA (1983).
J. R. Lamarsh, A. J. Baratta, Introduction to Nuclear Engineering, 3d ed., Prentice-Hall, 2001, ISBN: 0-201-82498-1.
W. M. Stacey, Nuclear Reactor Physics, John Wiley & Sons, 2001, ISBN: 0- 471-39127-1.