Comparison of Actual and Ideal Otto Cycles
 This section shows an ideal Otto cycle in which there are a lot of assumptions that differ from the actual Otto cycle. The main differences between the actual and ideal Otto engine appear in the figure. In reality, the ideal cycle does not occur, and there are many losses associated with each process. For an actual cycle, the shape of the pV diagram is similar to the ideal, but the area (work) enclosed by the pV diagram is always less than the ideal value. The ideal Otto cycle is based on the following assumptions:
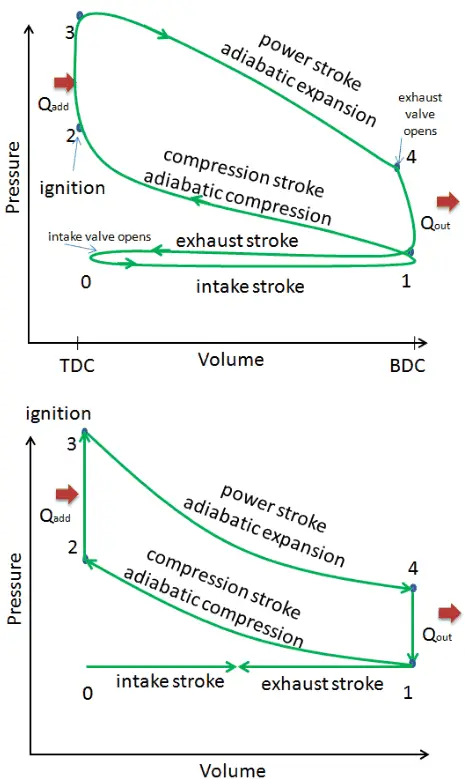
- Closed cycle. The largest difference between the two diagrams is the simplification of the intake and exhaust strokes in the ideal cycle. In the exhaust stroke, heat Qout is ejected into the environment. In a real engine, the gas leaves the engine and is replaced by a new mixture of air and fuel.
- Instantaneous heat addition (isochoric heat addition). In real engines, the heat addition is not instantaneous. Therefore the peak pressure is not at TDC but just after TDC.
- No heat transfer (adiabatic)
- Compression – The gas (fuel-air mixture) is compressed adiabatically from state 1 to state 2. In real engines, there are always some inefficiencies that reduce the thermal efficiency.
- Expansion. The gas (fuel-air mixture) expands adiabatically from state 3 to state 4.
- Complete combustion of the fuel-air mixture.
- No pumping work. Pumping work is the difference between the work done during the exhaust stroke and the intake stroke. In real cycles, there is a pressure difference between exhaust and inlet pressures.
- No blowdown loss. Blowdown loss is caused by the early opening of exhaust valves. This results in a loss of work output during the expansion stroke.
- No blow-by loss. The blow-by loss is caused by the leakage of compressed gases through piston rings and other crevices.
- No frictional losses.
These simplifying assumptions and losses lead to the fact that the enclosed area (work) of the pV diagram for an actual engine is significantly smaller than the area (work) enclosed by the pV diagram of the ideal cycle. In other words, the ideal engine cycle will overestimate the network and, if the engines run at the same speed, greater power is produced by the actual engine by around 20%.