
The phases of a substance and the relationships between its properties are most commonly shown on property diagrams. A large number of different properties have been defined, and there are some dependencies between properties.
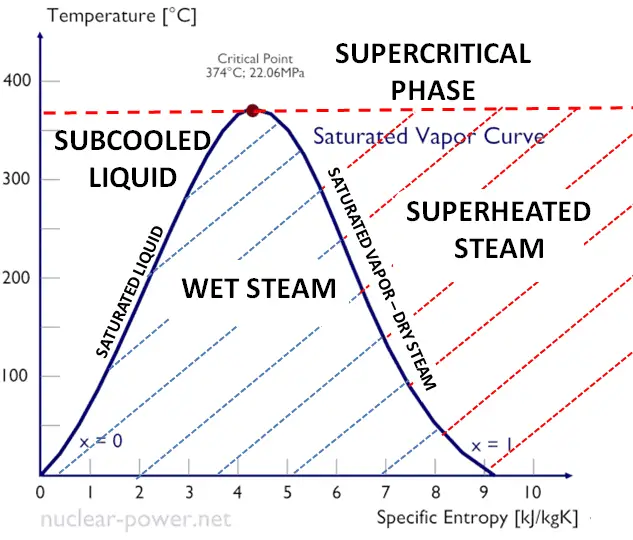
A Temperature-entropy diagram (T-s diagram) is the type of diagram most frequently used to analyze energy transfer system cycles. It is used in thermodynamics to visualize changes to temperature and specific entropy during a thermodynamic process or cycle.
The work done by or on the system and the heat added to or removed from the system can be visualized on the T-s diagram. By the definition of entropy, the heat transferred to or from a system equals the area under the T-s curve of the process.
dQ = TdS
An isentropic process is depicted as a vertical line on a T-s diagram, whereas an isothermal process is horizontal. In an idealized state, compression is a pump, compression in a compressor, and expansion in a turbine is isentropic. Therefore it is very useful in power engineering because these devices are used in thermodynamic cycles of power plants.
Note that the isentropic assumptions are only applicable with ideal cycles. Real thermodynamic cycles have inherent energy losses due to the inefficiency of compressors and turbines.
The specific entropy is included in the steam tables for pure substances like steam, similar to a specific volume, specific internal energy, and specific enthalpy.
The specific entropy of saturated liquid water (x=0) and dry steam (x=1) can be picked from steam tables. In the case of wet steam, the actual entropy can be calculated with the vapor quality, x, and the specific entropies of saturated liquid water and dry steam:
swet = ss x + (1 – x ) sl
where
swet = entropy of wet steam (J/kg K)
ss = entropy of “dry” steam (J/kg K)
sl = entropy of saturated liquid water (J/kg K)