Xenon is a naturally-occurring chemical element with atomic number 54, which means there are 54 protons and 54 electrons in the atomic structure. The chemical symbol for xenon is Xe. Xenon is a colorless, dense, odorless noble gas found in the Earth’s atmosphere in trace amounts.
Xenon was first discovered in 1898 by the Scottish chemist William Ramsay and English chemist Morris Travers. The name xenon for this gas comes from the Greek word ξένον [xenon], neuter singular form of ξένος [xenos], meaning ‘foreign(er)’, ‘strange(r)’, or ‘guest’.
Natural xenon consists of eight stable isotopes, 124Xe (0.095%), 126Xe (0.089%), 128Xe (1.91%), 129Xe (26.4%), 130Xe (4.07%), 131Xe (21.23%), 132Xe (26.91%), 134Xe (10.44%), and one isotope with very long half-life 136Xe (8.86%).
In the nuclear industry, especially artificial xenon 135 has a tremendous impact on the operation of a nuclear reactor. It is important for physicists and reactor operators to understand the mechanisms that produce and remove xenon from the reactor to predict how the reactor will respond following changes in power level.
Another important isotope is xenon 133, which has a half-life of 5.2 days, and its presence in a reactor coolant indicates (together with xenon 135) a possible failure of fuel cladding. A new defect will often result in a step increase in only the Xe-133 activity measured from reactor coolant. As the defect enlarges, the release rate of the soluble, longer-lived nuclides, particularly I-131, I-134, Cs-134, and Cs-137, will increase.
Xenon 135

Source: JANIS (Java-based Nuclear Data Information Software); The JEFF-3.1.1 Nuclear Data Library
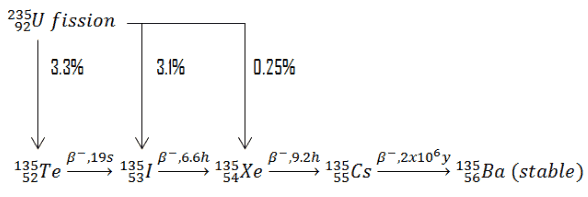
As was written, xenon 135 has a tremendous impact on the operation of a nuclear reactor. Xenon-135 is a product of U-235 fission and has a very large neutron capture cross-section (about 2.6 x 10⁶ barns). It also decays radioactively with a half-life of 9.1 hours. Little Xe-135 results directly from fission, but most comes from the decay chain, Te-135 (β– decay, 19 sec) to I-135 (β– decay, 6.6 hr) Xe-135. The instantaneous production rate of xenon 135 is dependent on the iodine 135 concentration and, therefore, on the local neutron flux history. On the other hand, the destruction rate of xenon 135 is dependent on the instantaneous local neutron flux. Its significance is primarily caused by two factors:
- its enormous capture cross-section
- its ultimate total yield, which is about 6.3%
In a typical nuclear reactor fueled with uranium 235, the presence of 135Xe as a fission product is of the highest importance in power operation. At zero-power operation, the presence of 135Xe may be neglected since its concentration is very low. At power operation, the situation is different.
Engineers and operators must perfectly know the behavior of a reactor with xenon 135. They are trained to properly anticipate and react to the transients induced by equilibrium or non-equilibrium xenon distribution. The presence of 135Xe is associated with the following operational issues:
- Equilibrium Xenon – Xenon Poisoning
- Equilibrium Xenon for Different Power Levels
- Response to Reactor Power Changes
- Iodine Pit – Response to Reactor Shutdown
- Spatial Xenon Oscillations
To understand these issues, we have to understand the production and removal of xenon 135 perfectly.
Production and Removal of Xenon 135
 In general, there are two ways of xenon 135 production in the reactor:
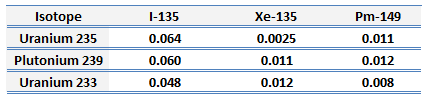
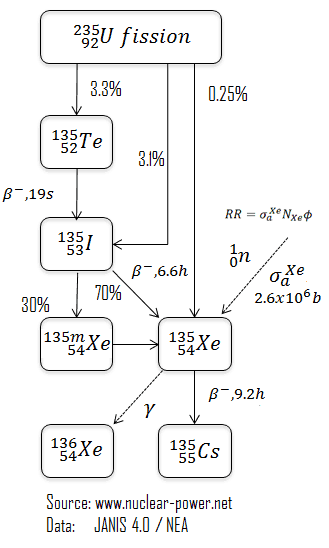
- Decay of 135I. Most xenon 135 is produced by beta decay of 135I (γI, total = 6.4%). The 135I is a direct fission product (γI = 3.1%) and a decay product of tellurium 135 (γTe = 3.3%), but the half-life of tellurium 135 is so short (~ 19 sec) that iodine-135 can be considered as the primary fission product. The fission yield (γ) for tellurium 135 is about 3.3%. Iodine 135 is not a strong neutron absorber but decays to form the neutron poison xenon 135. About 95% of all the xenon 135 produced comes from the decay of iodine 135. Therefore, the half-life of iodine 135 plays an important role in the amount of xenon-135 present. The instantaneous production rate of xenon-135 is dependent on the iodine-135 concentration and, therefore, on the local neutron flux history.
- Direct fission product. Xenon 135 is partly formed directly during fission. The fission yield (γXe) for xenon 135 is about 0.25%.
In general, there are two ways of xenon 135 removals from the reactor:
- Decay of 135Xe. Xenon 135 decay via beta minus decay with a half-life of 9.2 hours. The proportion of 135I and 135Xe half-lives is very important and determines transients, especially those with power reduction, where the xenon buildup rate is higher than xenon decay.
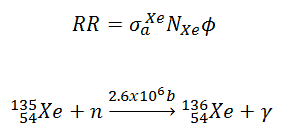
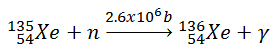
- Xenon burnup. Since xenon 135 has a very high neutron capture cross-section, it is significantly removed by neutron capture at significant neutron flux levels. The xenon burnup is determined by reaction rate:

Xenon 135 – Differential Equations
The production and removal of xenon can be characterized by the following differential equations:
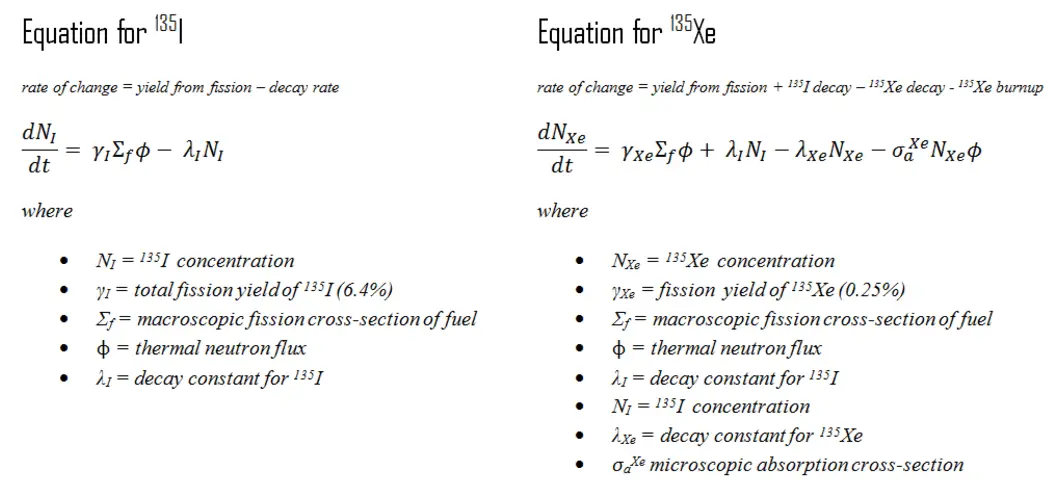
Note the coupling between the two equations. Decay of iodine 135, λINI, in the equation for iodine, produces xenon in the equation for xenon. As can be seen, we have neglected the burnup of 135I since its cross-section is very small. The xenon burnup term above refers to the following reaction: neutron absorption (or neutron capture) by xenon 135. Xenon 136 is not a significant neutron absorber. Therefore, the neutron absorption by xenon 135 constitutes the removal of poison from the reactor. The burnup rate of xenon 135 depends on the neutron flux and the xenon 135 concentration (i.e., the reaction rate).
Equilibrium Xenon – Stationary Xenon Poisoning
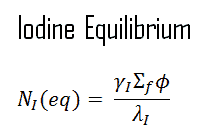
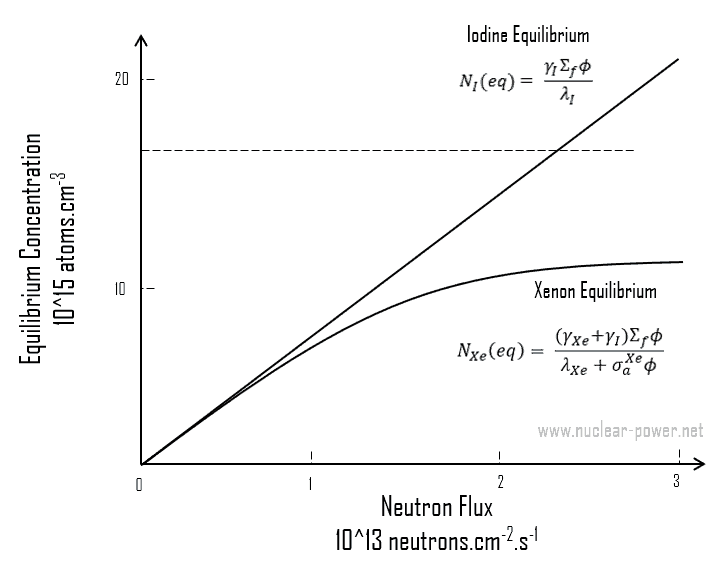
When the rate of production of iodine equals the rate of removal of iodine, equilibrium exists. This equilibrium is also known as “xenon 135 reservoir” since all of this iodine must undergo decay to xenon. The iodine concentration remains constant and is designated NI(eq) in equilibrium. The following equation for the iodine equilibrium concentration can be determined from the preceding equation by setting the dNI/dt =0. Since the equilibrium iodine concentration is proportional to the fission reaction rate, it is also proportional to the reactor power level.
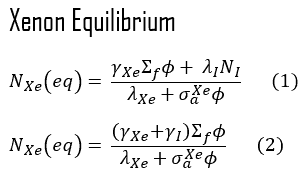
When the rate of production of xenon 135 equals the rate of removal, equilibrium also exists for xenon. The xenon concentration remains constant and is designated NXe(eq). The following equation (1) for the xenon equilibrium concentration can be determined from the preceding equation by setting the dNXe/dt =0. For xenon 135 to be in equilibrium, iodine 135 must also be in equilibrium. Substituting the expression for equilibrium iodine 135 concentration into the equation for equilibrium xenon (1) results in the following (2).
This equation shows that the equilibrium value for xenon 135 increases as power increases because the numerator is proportional to the fission reaction rate. But the thermal flux is also in the denominator. Therefore, as the thermal flux exceeds some value, the xenon burnup begins to dominate, and at approximately 1015 neutrons.cm-2.s-1, the xenon-135 concentration approaches a limiting value. The equilibrium iodine 135 and xenon 135 concentrations as a function of neutron flux are illustrated in the following figure.
Xenon 135 Worth after Reactor Startup
Following reactor startup, both iodine and xenon concentrations build from zero to equilibrium values for several half-lives (e.g., seven half-lives). Since the half-lives are in hours, after a few days (in about 40 to 50 hours.), equilibrium is achieved. This is known as stationary xenon poisoning. In pressurized water reactors, this stationary xenon poisoning reaches up to 2500 pcm. The excess reactivity must be able to compensate equilibrium xenon when the reactor is operated at nominal power. Stationary xenon poisoning usually does not vary with cycle burnup but differs significantly with the reactor power level.

Equilibrium xenon for different power levels
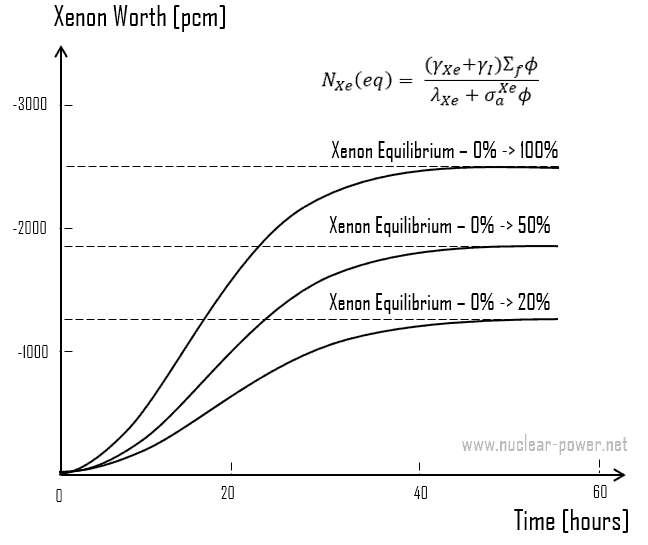 As was shown, the equilibrium iodine 135 and xenon 135 concentrations are a function of neutron flux. The higher the neutron flux, the higher the equilibrium xenon 135 concentration, but equilibrium xenon-135 is not directly proportional to neutron flux level (due to an increase in burnup rate). For example, equilibrium xenon 135 at 20% power is about half the value for equilibrium xenon 135 at 100% power for many reactors.
Because the xenon 135 concentration directly affects the reactivity level in the reactor core, the negative reactivity due to the xenon concentrations, known as the xenon worth, for different power levels or conditions is frequently plotted instead of the xenon concentration.
Response to Reactor Power Changes
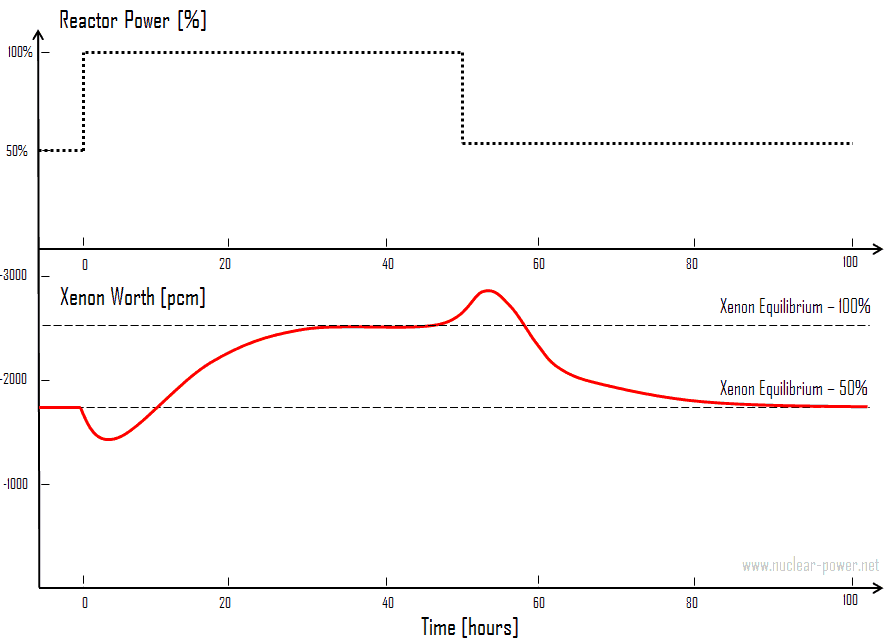
As can be seen, iodine and xenon concentrations significantly differ with certain neutron flux levels. Here, we will illustrate a typical xenon transient between different power levels. Recall the proportion of 135I (6.6h) and 135Xe (9.2) half-lives is very important and determines these transients, especially those with power reduction, where the xenon buildup rate is higher than xenon decay.
Consider the power increase from 50% to 100% of rated power. Consider a reactor that is operated at 50% for a long time (i.e., iodine and xenon equilibria are established). At time t0, reactor power is raised from 50% to 100% of rated power. When the reactor power increases, xenon concentration initially decreases because the burnup is increased due to a higher reaction rate. Because 95% of the xenon production is from iodine 135 decay, which has a 6.6 hours half-life, the production of xenon remains constant for several hours. After a few hours (roughly 4 to 6 hours depending on power levels), the rate of production of xenon from iodine and fission equals the rate of removal of xenon by burnup and decay. At this point, the xenon concentration reaches a minimum. The xenon concentration increases to the new equilibrium level for the new power level in roughly 40 to 50 hours. It should be noted that the magnitude and the rate of change of xenon concentration during the initial 4 to 6 hours following the power change is dependent upon the initial power level and on the amount of change in power level. The xenon concentration change is greater for a larger change in power level. For a power decrease, the behavior is reversed.
Iodine Pit – Response to Reactor Shutdown
The most spectacular and well-known phenomenon associated with xenon 135 is the behavior of a reactor after a reactor shutdown. Recall the proportion of 135I (6.6h) and 135Xe (9.2) half-lives is very important and determines these transients, especially those with power reduction, where the xenon buildup rate is higher than xenon decay.
Consider the reactor shutdown from 100% to zero. Consider the reactor that is operated at 100% for a long time (i.e., iodine and xenon equilibria are established). At time t0, reactor power fall from 100% to 0% of rated power (e.g., after SCRAM). After shutdown, xenon 135 is no longer produced by fission and is removed by burnup. The only remaining production mechanism is the decay of the iodine 135, which was in the core at the time of shutdown. The only removal mechanism for xenon 135 is decay. Therefore, when the reactor power is decreased, xenon concentration initially increases because the xenon burnup falls to zero, and the 135I decay (6.6 h) is faster than the 135Xe decay (9.2 h).
The rate of the increase depends on the original neutron flux and increases with increasing flux. For large values of the neutron flux, the peak concentration occurs at 11.3 hours after shutdown (ln( λΙ/λXe)/( λI − λXe) ≈ 11.3 hours). The peak is reached when the product of the terms λΙNI is equal to λXeNXe. The amount of additional negative reactivity in the xenon peak is strongly dependent on the original neutron flux. For the reactor shutdown (LWRs) from 100% to zero, the amount of additional negative reactivity may reach up to 2500 pcm, which has very important consequences. After reaching the xenon peak, the production of xenon from iodine decay is less than the removal of xenon by decay (λΙNI < λXeNXe), and the concentration of xenon 135 decreases. After another ten half-lives (from 11.3 hours to 80 hours), all the xenon undergo beta decay. The decay of xenon 135 causes a continuous insertion of positive reactivity. This positive reactivity insertion must be taken into account in subcriticality maintenance (i.e., SDM) or when approaching criticality. For LWRs, the xenon 135 concentration about 20 hours after shutdown from full power will be the same as the equilibrium xenon 135 concentration at full power. About 3 days after the shutdown, the xenon 135 concentration will have decreased to a small percentage of its pre-shutdown level. The reactor can be assumed to be xenon-free without a significant error introduced into reactivity calculations.
An important consequence of this ‘xenon peak’ after a reactor shutdown is that, unless sufficient additional reactivity is present, it cannot be possible to restart the reactor again before many hours have passed. This phenomenon is known as the “iodine pit” or “xenon pit,” and it is particularly important (LWRs) near or at the end of the cycle (EOC) since there is usually insufficient positive reactivity available from the chemical shim. At the end of the cycle, the additional xenon reactivity (up to 2500 pcm) may provide sufficient negative reactivity to make the estimated critical conditions out of the allowed range because there is insufficient positive reactivity available from the control rod removal or chemical shim to counteract it. In another case, when there is sufficient reactivity to make a reactor critical, there need not be enough reactivity to increase reactor power (i.e., balance power defect).
The inability of the reactor to be started due to the effects of xenon is sometimes referred to as xenon precluded startup. It is particularly important for reactors with very small excess reactivity (e.g., Heavy Water Reactors). The period where the reactor is unable to “override” the effects of xenon 135 is called “xenon dead time”.
Thermal power reactors are normally limited to flux levels of about 5 x 10¹³ neutrons/cm-2.s-1 to ensure timely restart after shutdown. For reactors with very low thermal flux levels (~5 x 10¹³ neutrons/cm-2.s-1 or less), most xenon is removed by decay as opposed to xenon burnup. For these cases, reactor shutdown does not cause any xenon 135 peaking effects. Following the peak in xenon 135 concentration about 10 hours after shutdown, the xenon 135 concentration will decrease at a rate controlled by the decay of iodine 135 into xenon 135 and the decay rate of xenon 135.
Spatial Xenon Oscillations
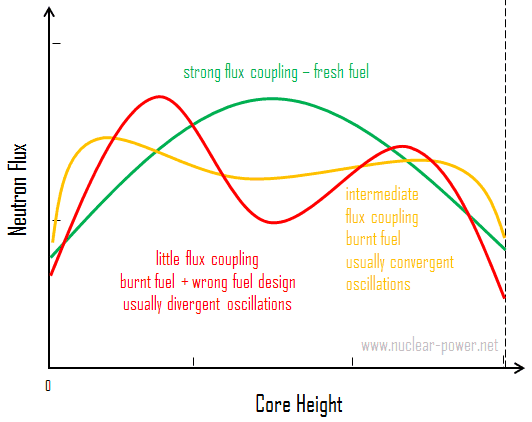 Large thermal reactors with little flux coupling between regions may experience spatial power oscillations because of the non-uniform presence of xenon 135. Xenon-induced spatial power oscillations occur due to rapid perturbations to power distribution that cause the xenon and iodine distribution to be out of phase with the perturbed power distribution. This results in a shift in xenon and iodine distributions that causes the power distribution to change in the opposite direction from the initial perturbation.
Xenon-135 is a product of U-235 fission and has a very large neutron capture cross-section(about 2.6 x 10⁶ barns). It also decays radioactively with a half-life of 9.1 hours. Little Xe-135 results directly from fission, but most comes from the decay chain, Te-135 (β– decay, 0.5 min) to I-135 (β– decay, 6.6 hr) Xe-135. The instantaneous production rate of xenon-135 is dependent on the iodine-135 concentration and, therefore, on the local neutron flux history. On the other hand, the destruction rate of xenon-135 is dependent on the instantaneous local neutron flux.
The combination of delayed generation and high neutron-capture cross-section produces diverse impacts on nuclear reactor operation. The mechanism is described in the following four steps.
- An initial lack of symmetry (let’s say the axial symmetry in case of axial oscillations) in the core power distribution (for example, as a result of significant control rods movement) causes an imbalance in fission rates within the reactor core, and therefore, in the iodine-135 buildup and the xenon-135 absorption.
- In the high-flux region, xenon-135 burnout allows the flux to increase further, while in the low-flux region, the increase in xenon-135 causes a further reduction in flux. The iodine concentration increases when the flux is high and decreases when the flux is low. This shift in the xenon distribution is to increase (decrease) the multiplication properties of the region in which the flux has increased (decreased), thus enhancing the flux tilt.
- As soon as the iodine-135 levels build up sufficiently, decay to xenon reverses the initial situation. Flux decreases in this area, and the former low-flux region increases power.
- Repetition of these patterns can lead to xenon oscillations moving about the core with periods on the order of about 24 hours.
With little change in the overall power level, these oscillations can significantly change the local power levels. This oscillation may go unnoticed and reach dangerous local flux levels if only the total power of the core is monitored. Therefore most PWRs use tandem power range excore neutron detectors to monitor the upper and lower halves of the core separately.
Spatial xenon oscillations are typical for power reactors since they operate at higher neutron fluxes, in which the xenon burnup becomes a very strong component of the xenon 135 dynamics. To sustain a significant xenon oscillation, the average thermal flux of the reactor should be greater than 1013 neutrons/cm-2.s-1 (typical PWR has about 3×10¹³ neutrons/cm-2.s-1). Together with the high flux, the reactor core should be large relative to the migration length such that both halves of the core can be assumed to operate independently. Almost all PWRs meet these conditions. Consequently, they are vulnerable to xenon oscillations. Both a commercial reactor’s radial and axial dimensions are large enough to sustain xenon oscillations. However, the axial oscillations are the ones of major concern in most cases.
In a reactor system with strong negative temperature coefficients, the xenon 135 oscillations and very high flux coupling are damped quite readily. This is one of the reasons for designing reactors to have negative moderator temperature coefficients.
Since this effect influences global power distribution in the core, it also influences local power distribution. The problem, however, is in the initial swing of flux levels which displace the flux upward. Since at the higher elevations, the local linear heat rate (FQ(z) limit) is highly restrictive, large xenon spatial oscillations have to be minimized to prevent exceeding FQ limits.
Spatial Xenon Oscillations Control
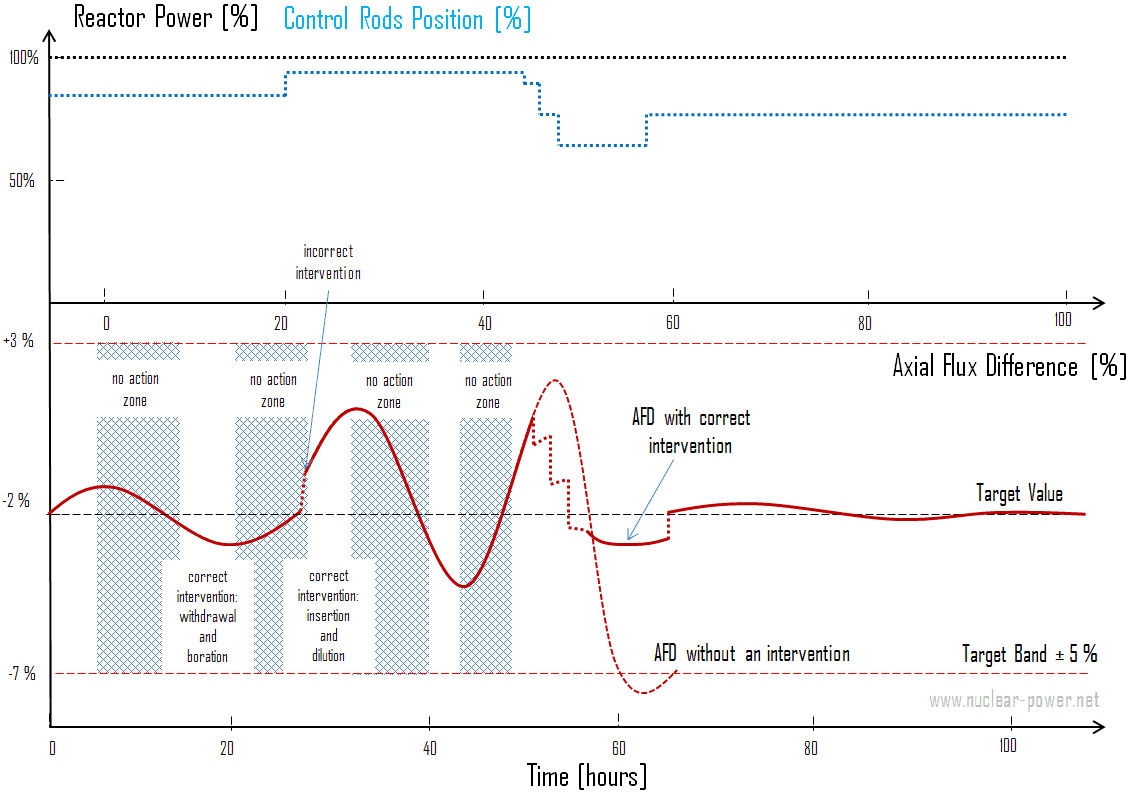 The axial flux difference or the axial offset are introduced to control xenon spatial oscillations. The axial flux difference (AFD) limits are most important. AFD measures the imbalance between the upper and lower halves of the core in terms of power or flux (ΔI). The AFD is determined from the outputs of the upper and lower excore neutron detectors, which belong to the so-called excore nuclear instrumentation system (NIS). AFD is controlled by control rods. The control rod banks can be inserted into the core from the top. Therefore, a control rod bank motion will result in symmetric reactivity insertion in the core in the radial and azimuthal directions. Still, the reactivity insertion will not be symmetric in the axial direction. As a result, a control rod bank insertion causes a decrease in AFD since the power is shifted from the upper half to the lower half of the core. A proper intervention by controlling rods in proper time can lead to damping the oscillation.
There are different control schemes based on the availability of control mechanisms. The most commonly used control mechanism of axial oscillations is based on Part Length Control Rods (PLCRs), which are moved around the central part of the core. A shift in AFD, either up or down, will then be controlled by moving the PLCRs in the proper direction. The rod control system automatically modulates the insertion of these control rods, which control the axial power distribution. These control rods are also called “grey” control rods. Grey control rods use a grey neutron absorber, which absorbs less neutrons than a “black” absorber.
If there are no PLCRs, the control strategy will be completely different. Additional control mechanisms are the inlet temperature, boron concentration in the reactor coolant, and positions of Full-Length Control Rods. In any case, however, the strategy is quite simple and heuristic. The operator must respond to an oscillation with a sensible control action. The problem that must be solved is the quantification and the timing of this action. A method, which combines proper actions (insertion and withdrawal), is known as the Bang-Bang control.
Continued operation with a significant spatial xenon oscillation could lead, at least, to a reactor trip or, more seriously, to dangerously high local fuel temperatures. Even without such severe consequences, xenon oscillations cause unnecessary temperature cycling, leading to premature materials failure.
Axial Flux Difference
AFD is defined as:
AFD or ΔI = Itop – Ibottom
where Itop and Ibottom are expressed as a fraction of rated thermal power, as an example, assume the core is operating at 100% power. When the Itop = 49% and Ibottom = 51% the resulting ΔI = -2%. When the delta flux target is -5%. The core would then be able to operate with a delta flux of -10% to 0%. The + 5% and -5% flux difference around the target allows for a small amount of movement of the control rods.
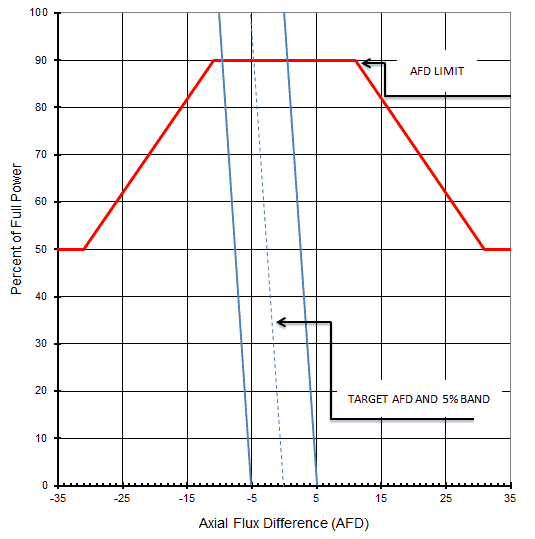 During power operation, the AFD is maintained within the specified limits. Compliance with the AFD limits prevents a highly top- or bottom skewed axial power distribution. By limiting the amount of power distribution skewing, core peaking factors are consistent with the assumptions used in the safety analyses. Limiting power distribution skewing over time also minimizes the xenon distribution skewing, a significant factor in axial power distribution control.
The operating scheme used to control the axial power distribution involves maintaining the AFD within a tolerance band around a burnup dependent target, known as the target flux difference, minimizing the variation of the axial peaking factor and axial xenon distribution during unit maneuvers.
For plants operating with so-called “constant axial offset control – CAOC”, the AFD limit involves a target band. This target band is, for example, +5% and -5% around the target value. Since the xenon concentration and distribution are flux and time-dependent, the longer the core operates outside its target band, the greater the probability of initiating a xenon transient.
At equilibrium xenon conditions, the target flux difference (ΔItarget) and its burnup dependent value are determined. The AFD is sensitive to many-core-related parameters such as control bank positions, core power level, axial burnup, axial xenon distribution, and, to a lesser extent, reactor coolant temperature and boron concentrations.
Constant Axial Offset Control (CAOC) is a strategy used to control axial power distribution in normal operations. CAOC requires that the AFD must be controlled within a narrow tolerance band around a burnup-dependent target to minimize the probability of initiation xenon oscillations during power maneuvers. It also minimizes the variation of axial peaking factors.
Axial offset is defined as:
A/O = (Itop – Ibottom)/(Itop + Ibottom)
where Itop and Ibottom are expressed as a fraction of rated thermal power.
AFD and Safety Analyses
In summary, the AFD and the QPTR are direct and continuous measures of the core’s global power distribution. AFD measures global axial power distribution, whereas QPTR measures global azimuthal power distribution. Staying within their limits and proper operation of the control rods should continuously maintain acceptable peaking factors (FQ(z) and FΔH). The AFD and QPTR limits ensure that peaking factors (FQ(z) and FΔH) remain below their limiting values by preventing an undetected change in the gross axial and radial power distribution.
Together, the LCO limits on the AFD, the QPTR, the rod insertion limits and the power distribution (i.e., the Heat Flux Hot Channel Factor (FQ(z)), the Nuclear Enthalpy Rise Hot Channel Factor (FNΔH)) are established to preclude core power distributions that exceed the safety analyses limits.