All PWR plants during core loading have monitored the instantaneous neutron count rate and the ICRR (Inverse Count Rate Ratio or 1/M) to avoid an inadvertent and unexpected approach to criticality, to provide an alarm to which the operator can respond, and to terminate the event.
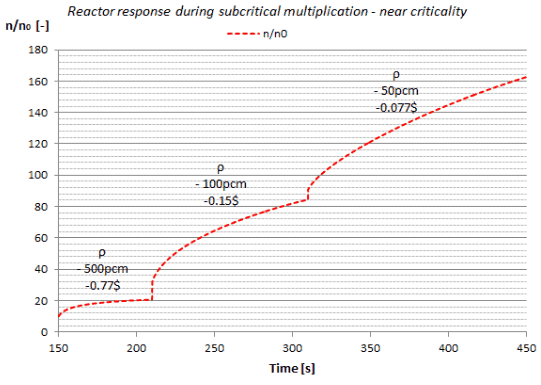
It is obvious the subcritical multiplication factor significantly rises:
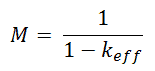
 Because the subcritical multiplication factor is related to the value of keff (core subcriticality), it is possible to monitor the approach to criticality through the use of the subcritical multiplication factor. The closer the reactor is to criticality, the faster M will increase for equal step insertions of positive reactivity. When the reactor becomes critical, M will be infinitely large. Monitoring and plotting M during a criticality approach is impractical because there is no value of M at which the reactor clearly becomes critical.
On the other hand, the neutron flux is monitored via source-range detectors, where the count rate (CR) gets infinitely large as the core approaches keff = 1.0. Note that the count rate of source-range detectors is proportional to the neutron population (n ∝ CR). which can be determined by the source-range count rate.
Therefore, instead of plotting M directly, its inverse (1/M or 1/CR) is plotted on a graph of:
- 1/CR versus rod elevation (in case of criticality approach by control rod withdrawal)
- 1/CR versus boron concentration (in case of criticality approach by boron dilution)
- 1/CR versus the number of fuel assemblies (in case of loading of fuel into the core)
Note that a true 1/M plot requires knowledge of the neutron source strength. Because the actual source strength is usually unknown, a reference count rate is substituted. As criticality is approached, 1/CR approaches zero. Therefore in startup procedure, the value of 1/CR provides engineers with an effective tool for monitoring the approach to criticality.
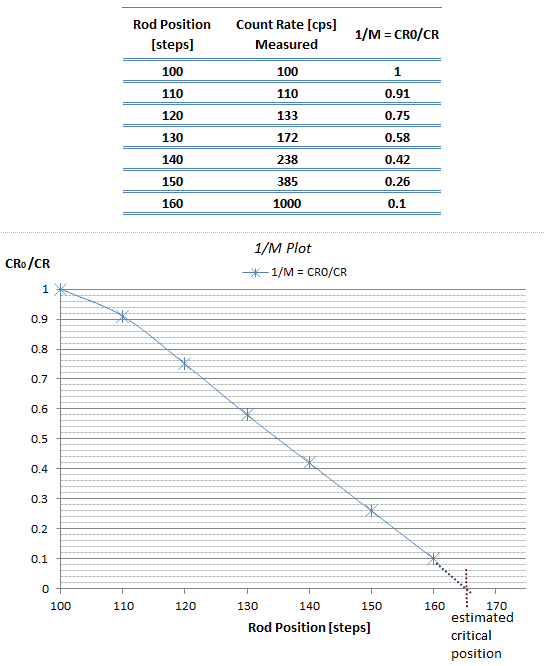
Example of 1/M Plot
Assume a criticality approach by controlling rod withdrawal. For this procedure, operators check especially the control rod’s position (usually in steps) and the count rate (CR) from source-range detectors. The initial count rate on the detectors prior to rod withdrawal is 100 cps. There are main parameters in the following table. From these parameters, the 1/M Plot is constructed. As can be seen, the estimated critical parameters can be predicted with extrapolation to the point where CR0/CR → 0.